

How to Validate US Demand Before You Commit to an Expansion
March 15, 2026
Building a US Customer Success Model as a European SaaS Company
May 15, 2026

US vs. Europe SaaS Benchmarks: CAC, ACV, and Sales Cycle Length
Comparing your European sales metrics to unadjusted US benchmarks is a fast way to make your team feel like they’re underperforming when they’re not. The European starting reality is structurally different: early-stage ACVs run lighter than the US equivalent for the same product, because the first customers in each new country are naturally more cautious, and cycles run longer as a result.
Why the European starting point looks worse than it is
The US SaaS market is close to one language, one contract norm, and one dominant buying culture. Selling from Europe means navigating a dozen procurement styles, VAT and invoicing quirks, and — depending on the market — works-council approvals, none of which the US benchmarks account for. The practical result: smaller early ACVs, longer cycles, slower ramp, and lower cold-outreach reply rates than the US headline figures suggest. That’s not your team underperforming — it’s a different starting line, and it’s exactly why our SaaS pricing strategy guide treats US and European pricing instincts as two separate exercises rather than one converted currency.
CAC payback: what’s healthy, by segment
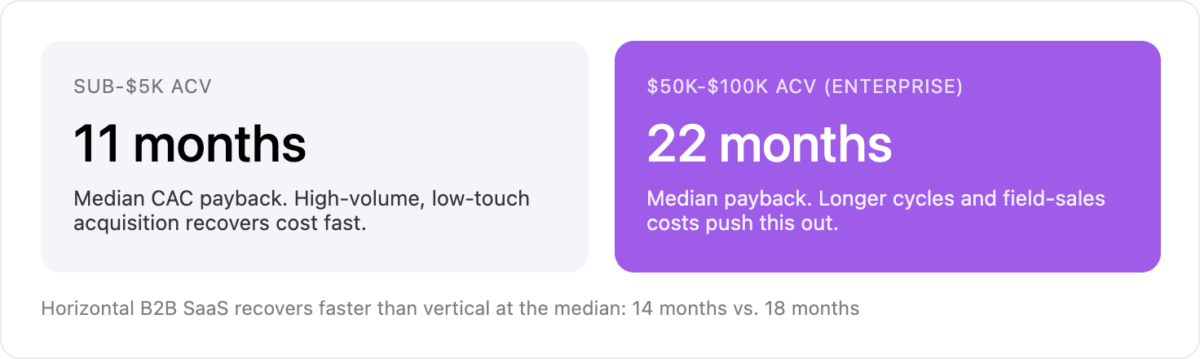
CAC payback period varies enormously by deal size, and benchmarking yourself against an all-in median makes an efficient enterprise motion look inefficient and an efficient SMB motion look wasteful.
Sales cycle length by ticket size
The rule of thumb is straightforward: every zero added to the ACV roughly doubles or triples the sales cycle. A €5K deal closes in weeks. A €500K deal closes in quarters, not weeks.
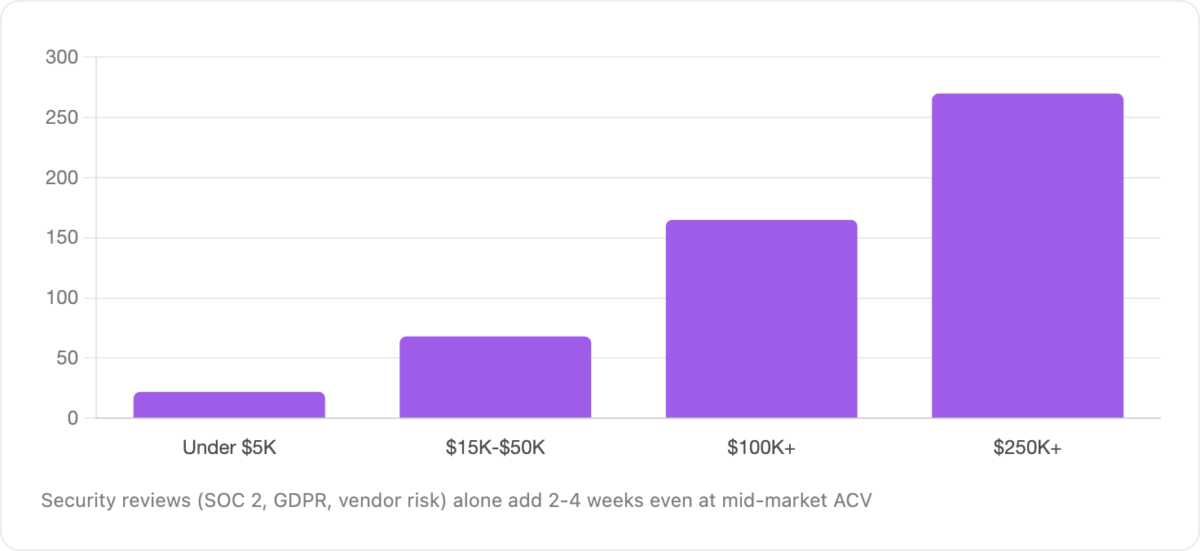
Enterprise cycles carry more than just a bigger number of stakeholders. Security reviews — SOC 2, GDPR, vendor risk assessments — have become standard even at mid-market ACV, adding two to four weeks that weren’t part of the process a few years ago. If your product touches that review at all, it’s worth having your SOC 2 story ready before the cycle starts, not once it’s already stalled a deal.
Which benchmark to use when selling from Europe to the US
The KBCM SaaS Survey — one of the most-cited public datasets in the category, per a 2026 European SaaS benchmark analysis — consistently shows median ACVs clustering in the low tens of thousands of dollars for the broad SaaS population, with a strong relationship between ACV and everything downstream: cycle length, CAC, and who does the selling. In Europe specifically, early-stage ACVs often run lighter than the same product’s US equivalent, simply because the first customers in any new country are the most cautious ones.
The practical rule: measure win rate on qualified opportunities only, agree on stage definitions across the team so everyone applies them consistently, and expect the stage-to-close conversion rate to improve as qualification gets stricter — not as reps get luckier.
How to read these metrics on your own dashboard
Compare yourself within your own ACV band, not against an all-in median that blends a 30-day HR-tech deal with a 270-day cybersecurity enterprise deal. A rising win rate on a shrinking, better-qualified pipeline is a good sign. A rising win rate because you stopped logging losses is a number you’re lying to yourself with. Track CAC payback and sales cycle together — a healthy LTV:CAC ratio starts around 3.0x, with top performers reaching 3.5x or higher — and revisit the benchmark every time your ACV band shifts, since last year’s healthy number stops being the right target the moment your deal size changes.
ABOUT THE AUTHOR
Written by Luca Lundgren, Founder at Demand Scalers. Luca has five years of demand generation experience working with companies like Simplex Wireless and Dentsu, and holds a Master’s in Marketing from Aalto University.